6/17/2026
Mobile App Monitoring Metrics Every Startup Should Track
Track the mobile app monitoring metrics startups need for reliability, speed, retention, revenue, and confident iOS and Android launches.
A startup does not need a wall of dashboards to run a reliable mobile app. It needs a small, disciplined set of mobile app monitoring metrics that show whether users can open the app, complete the core journey, and keep coming back.
That distinction matters. Early teams often over-instrument technical events while missing the signals investors, customers, and product leaders actually care about. A crash rate is important, but so is the percentage of new users who finish onboarding. API latency matters, but only because it slows down actions such as booking, purchasing, messaging, tracking, or subscribing.
The best monitoring strategy connects engineering health with product outcomes. Below is a practical framework for the metrics every startup should track across reliability, performance, user behavior, growth, and release quality.
Start with the core user journey
Before picking tools or dashboards, define the app's core journey. For a marketplace, that might be search, listing detail, checkout, and confirmation. For a health app, it might be sign-up, permissions, daily check-in, and progress tracking. For a fintech app, it might be identity verification, account connection, transaction review, and alert setup.
Monitoring should answer one simple question: can users successfully complete that journey right now?
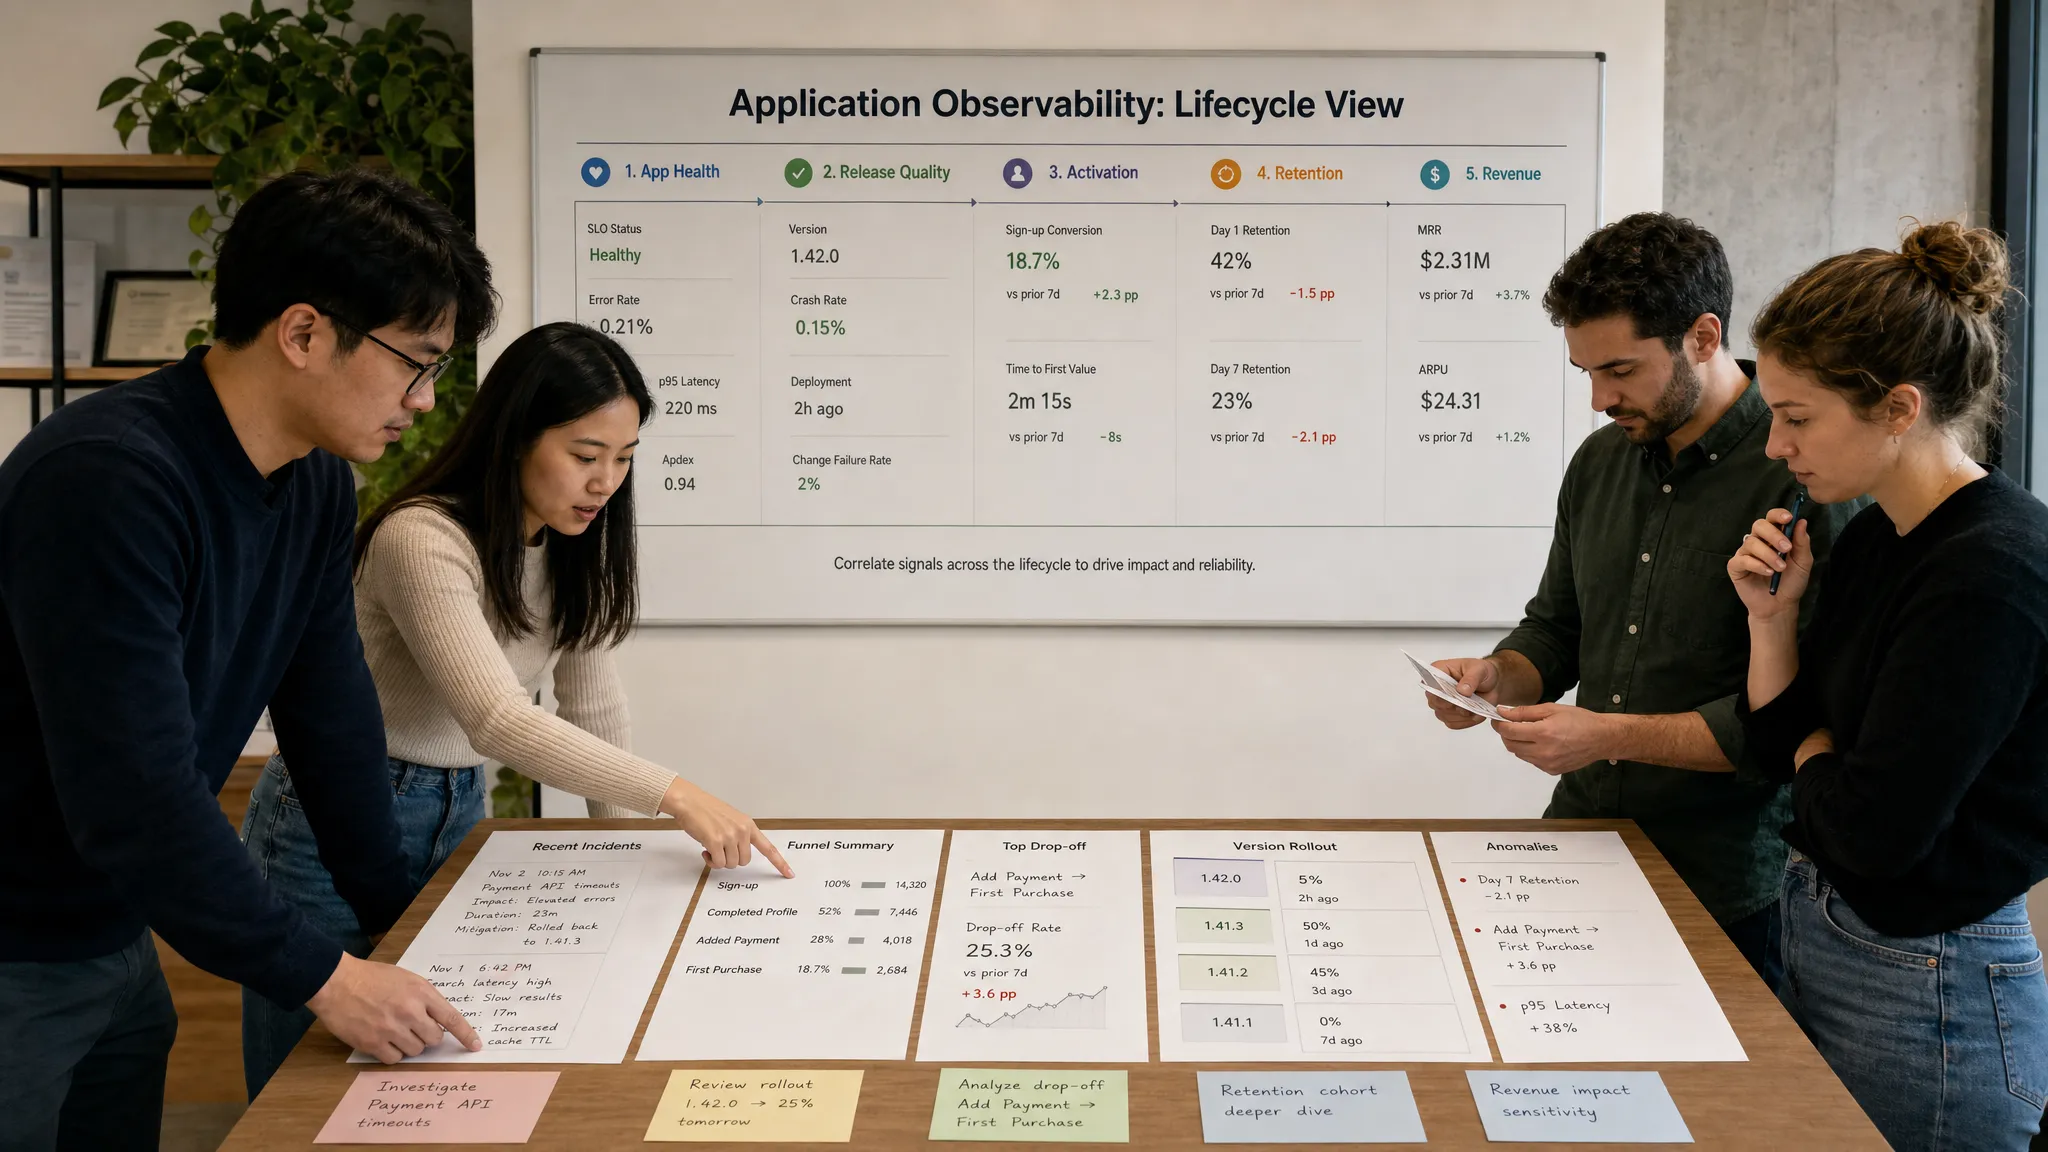
A good startup dashboard usually has five layers:
| Monitoring layer | What it tells you | Example metrics |
|---|---|---|
| App reliability | Whether the app stays usable | Crash-free sessions, ANR rate, hangs, failed launches |
| App performance | Whether the app feels fast | Startup time, screen load time, API latency, memory usage |
| Backend health | Whether services support the app | Error rate, uptime, queue delays, database latency |
| Product behavior | Whether users find value | Activation, retention, task completion, feature adoption |
| Business impact | Whether the app supports growth | Conversion, revenue, churn, LTV, CAC payback |
If you want a deeper foundation for instrumentation and observability, Appzay's guide to monitoring app essentials for reliable mobile products is a useful companion. This article focuses specifically on which metrics to prioritize and how to interpret them.
Reliability metrics: Can users trust the app?
Reliability metrics are the first line of defense. If users cannot open the app, keep a session alive, or complete a key action without errors, every other growth metric becomes harder to improve.
Crash-free users and crash-free sessions
Crash-free users show the percentage of users who did not experience a crash during a selected period. Crash-free sessions show the percentage of sessions that ended without a crash. Both are useful, but they tell slightly different stories.
Crash-free users are usually more meaningful for product and customer experience because a single crash can break trust for that person. Crash-free sessions are helpful for engineering teams because they show how often crashes occur relative to usage volume.
Track crash metrics by:
- App version
- Operating system version
- Device model
- Network type
- User segment
- Critical flow, such as onboarding, checkout, or upload
A startup should never look at crash rate as a single global number. A 0.5 percent crash rate might look acceptable until you discover that 8 percent of users on a specific Android device crash during registration.
ANRs, freezes, and hangs
Crashes are obvious. Freezes are more subtle, but often just as damaging. On Android, Application Not Responding errors are tracked by Google Play as part of Android vitals, which helps teams identify stability and performance problems that affect user experience. On iOS, teams can use diagnostics and Apple frameworks to identify hangs and responsiveness issues.
A frozen app creates uncertainty. Users may tap repeatedly, force close, abandon the task, or leave a poor review. Track hangs by screen and flow, not only by app version.
Failed launches and login failures
Not every reliability issue appears as a crash. Users may open the app and get stuck on a blank screen, fail to authenticate, or be blocked by a configuration error.
Track failed launches separately from crashes. A failed launch can be caused by remote configuration, expired certificates, incompatible backend responses, permission issues, or a dependency that fails before the app becomes usable.
Login failures deserve their own dashboard. If authentication breaks, your active user base can disappear overnight. Segment login failures by provider, such as email, Apple, Google, SMS, SSO, or magic link.
API error rate
Most mobile apps are only as reliable as the services behind them. Track API error rates by endpoint and user journey. A 500 error on a rarely used settings endpoint matters less than a 500 error on payment confirmation.
Useful cuts include:
- HTTP status code
- Endpoint
- App version
- Region
- User type
- Retry success rate
Retries can hide reliability problems. If an API fails once and succeeds on retry, the user may still experience delay, duplicate loading states, or uncertainty. Track both final failures and retry volume.
Performance metrics: Does the app feel fast?
Performance is not only an engineering concern. It affects conversion, retention, support volume, app ratings, and brand perception. Users rarely say the API p95 latency is poor. They say the app feels slow.
App startup time
Startup time is one of the most important mobile app monitoring metrics because it shapes the user's first impression in every session. Track cold start, warm start, and time to interactive.
Cold start measures the app opening from a fully closed state. Warm start measures reopening from memory. Time to interactive measures when the user can actually do something useful, which is often more important than when the first screen appears.
Heavy SDKs, blocking network calls, inefficient initialization, and large local databases can all slow startup. If your app uses personalization, remote config, or location, make sure those services do not block the first usable screen unless absolutely necessary.
Screen load time and action latency
Screen load time measures how long it takes for key screens to become useful. Action latency measures how long it takes after a user taps, submits, swipes, uploads, saves, or purchases.
Track p50, p95, and p99, not just average. Averages hide painful outliers. If most users see a screen in 800 milliseconds but 5 percent wait 8 seconds, those 5 percent are likely to churn or complain.
For startup teams, prioritize performance monitoring on revenue and retention flows first:
| Flow type | Performance signal to track | Why it matters |
|---|---|---|
| Onboarding | Time to complete sign-up | Slow onboarding reduces activation |
| Checkout or booking | Tap-to-confirm latency | Delays create purchase anxiety |
| Search or discovery | Time to first result | Slow discovery reduces engagement |
| Upload or sync | Success time and retry count | Failed sync can break trust |
| Messaging or alerts | Delivery delay | Late notifications reduce usefulness |
For a deeper performance-focused approach, Appzay's article on app optimization for speed, battery, and retention explains how speed work connects directly to user outcomes.
Memory, CPU, and battery impact
Resource usage is especially important on older devices, lower-memory Android phones, and apps used for long sessions. High memory usage can cause background termination. High CPU usage can create heat, drain battery, and make the app feel sluggish.
Apple's MetricKit provides reports for areas such as crashes, hangs, CPU, memory, disk writes, and battery-related diagnostics. Android teams can combine Play Console vitals with in-app telemetry and performance tools.
Do not wait until users complain that the app drains their battery. By then, you may already have poor reviews, reduced session frequency, and uninstalls.
Product metrics: Are users getting value?
Technical health only matters if it supports product value. A perfectly stable app with weak activation or poor retention is still at risk. Startups should monitor behavior metrics alongside performance metrics so the team can see how reliability affects growth.
Activation rate
Activation measures the percentage of new users who reach a meaningful first success moment. This is not always account creation. It is the moment when the user experiences the app's promise.
Examples include:
- A fitness user completes the first workout plan
- A marketplace buyer saves or purchases the first item
- A productivity user creates and shares the first project
- A finance user connects the first account
- A delivery user completes the first order
Your activation metric should be specific, measurable, and tied to long-term retention. If activated users retain at a much higher rate than non-activated users, you have chosen the right event.
Funnel completion and drop-off
Every critical journey should have a funnel. At minimum, track onboarding, payment, subscription, booking, account setup, referral, and any action that represents the app's main value.
A funnel should show where users drop, how long each step takes, and whether technical errors correlate with abandonment. For example, if users abandon identity verification on older devices, the cause might be camera permissions, image upload failures, or slow document processing.
Retention by cohort
Retention tells you whether users come back after first use. Track day 1, day 7, day 30, and longer periods if your app has a slower usage cycle.
Cohort retention is more useful than blended retention. A startup should know whether users acquired this week retain better than users acquired last month, and whether a new release improved or damaged retention.
Segment retention by acquisition channel, platform, app version, geography, and activation status. If activated users retain well but overall retention is poor, your onboarding needs work. If activated users also leave quickly, your core value loop may be weak.
Feature adoption
Feature adoption shows whether users engage with the parts of the app you built. It is especially useful after launching a new capability, pricing tier, or redesign.
Track adoption in context. A low adoption rate may mean users do not need the feature, but it may also mean the feature is buried, slow, confusing, or not relevant to that segment.
Business metrics: Is the app supporting growth?
Mobile monitoring should not stop at engineering and product analytics. Founders need to understand how the app affects revenue, acquisition efficiency, and unit economics.
Conversion rate
Conversion rate depends on your model. It may mean visitor to sign-up, free to paid, trial to subscription, listing view to booking, cart to purchase, or lead to qualified appointment.
Track conversion by app version and platform. A subtle iOS layout issue or Android payment bug can reduce revenue without creating obvious crash alerts.
Revenue per user and purchase success
If your app monetizes through subscriptions, in-app purchases, bookings, commissions, or commerce, track revenue events carefully. Monitor purchase attempt rate, payment authorization failures, receipt validation failures, refund rate, renewal rate, and revenue per active user.
Revenue instrumentation must be accurate enough for decisions. A dashboard that double-counts trials or misses refunds can lead to poor growth decisions.
CAC, LTV, and channel quality
Acquisition metrics belong in the same conversation as product monitoring. If paid campaigns bring users who crash during onboarding or never activate, the issue may be technical, product-related, or channel-related.
For apps in sports, fitness, and wellness, it can be valuable to align in-app activation and retention data with growth partners such as performance marketing and brand accelerator teams that understand how creative, paid media, and conversion rate optimization affect downstream quality.
The key is not to judge acquisition only by install volume. Measure the quality of acquired users after they enter the app.
Release health metrics: Did the new version make things better or worse?
Every mobile release is a controlled risk. Even a well-tested update can behave differently across devices, OS versions, networks, and real user behavior.
Track release health from the first rollout percentage. Do not wait until 100 percent of users have the update.
| Release metric | What to compare | Decision it supports |
|---|---|---|
| Crash-free users | New version vs previous stable version | Continue, pause, or roll back rollout |
| ANR or hang rate | By OS and device family | Identify platform-specific regressions |
| Startup time | New version vs baseline | Detect slow initialization or SDK issues |
| API error rate | By app version | Catch contract mismatches or backend bugs |
| Activation and conversion | New version vs prior cohorts | Confirm product changes are helping |
| Support tickets and reviews | Before and after release | Detect user pain that metrics miss |
A strong release process includes dashboards, alert thresholds, ownership, and a rollback or hotfix plan. Appzay's mobile app launch checklist and strategy for 2026 covers the broader launch discipline around readiness, rollout, and post-launch monitoring.
Support and sentiment metrics: What are users telling you?
Dashboards show patterns, but user feedback explains pain. Support tickets, app reviews, cancellation reasons, and in-app feedback should be connected to technical and product events.
Monitor app store rating trends by version. A rating drop after a release can be a release-health signal even when crash metrics look stable. Tag reviews by theme, such as login, payments, performance, design confusion, missing features, or notification issues.
Support metrics worth tracking include first response time, time to resolution, ticket volume by app version, ticket volume by feature, and percentage of tickets tied to known incidents.
The best teams close the loop. If users complain about slow uploads, the team should be able to inspect upload success rates, retry counts, file sizes, network types, and affected devices.
Alerting metrics: What deserves immediate attention?
Not every metric needs an alert. Too many alerts create fatigue, and fatigued teams ignore real incidents. Startup monitoring should separate dashboards from wake-up signals.
Use alerts for urgent, user-impacting changes such as a spike in crashes, a payment failure increase, authentication outage, backend error surge, push notification failure, or severe latency regression in a core flow.
Use dashboards for trends that need weekly review, such as retention, feature adoption, support volume, battery usage, and conversion by cohort.
A simple alerting model works well:
| Alert priority | Example trigger | Expected response |
|---|---|---|
| Critical | Login, payment, or launch failure spike | Immediate triage and incident owner |
| High | Crash or API error increase in latest release | Same-day investigation |
| Medium | Performance regression in a core flow | Prioritize in sprint or hotfix if severe |
| Low | Gradual decline in engagement or adoption | Review in product meeting |
The goal is not to know everything in real time. The goal is to know the right things early enough to protect users.
How to choose your first startup monitoring dashboard
If your team is early, resist the temptation to track 100 metrics. Start with a dashboard that fits on one screen and answers the most important questions.
A strong first dashboard should include:
- Crash-free users and sessions
- ANR, freeze, or hang rate
- App startup time and key screen load time
- API error rate and latency for core endpoints
- Activation rate and onboarding completion
- Retention by cohort
- Conversion or revenue event success
- App store rating trend and support ticket volume
Review this dashboard after every release, every growth campaign, and every major product change. Over time, add deeper metrics only when they support decisions.
Common mistakes startups make with mobile app monitoring
The most common mistake is treating monitoring as something to add after launch. By then, the team may lack baseline data, event naming may be inconsistent, and the first production issue may be harder to diagnose.
Another mistake is separating engineering and product analytics. If crash data lives with developers and retention data lives with marketing, the team may miss the connection between a technical regression and a growth decline.
Startups also over-rely on averages. Average latency, average session duration, and average revenue per user can all hide segment-level problems. Always inspect p95 and p99 performance, cohorts, devices, operating systems, and app versions.
Finally, many teams fail to define ownership. A metric without an owner becomes background noise. Every critical metric should have someone responsible for reviewing it, explaining changes, and coordinating action.
Frequently Asked Questions
What are the most important mobile app monitoring metrics for a startup? The most important metrics are crash-free users, app startup time, API error rate, activation rate, retention, conversion, and release health by app version. These give founders a balanced view of reliability, performance, and growth.
How often should a startup review mobile app monitoring metrics? Engineering teams should watch critical reliability alerts continuously after release, while founders and product leads should review a focused dashboard weekly. After a major launch or paid campaign, review metrics daily until performance stabilizes.
Should startups track technical metrics or business metrics first? Track both, but keep the first dashboard small. Technical metrics show whether the app works, while business metrics show whether users find value. The strongest teams connect the two instead of treating them separately.
What is the difference between app monitoring and product analytics? App monitoring focuses on health signals such as crashes, latency, errors, and resource usage. Product analytics focuses on behavior such as onboarding, retention, feature adoption, and revenue. A startup needs both to understand the full user experience.
When should monitoring be added to a mobile app? Monitoring should be planned before launch and implemented during development, not after the first production incident. Early instrumentation helps teams compare beta results, launch performance, and post-release changes with confidence.
Build monitoring into the product, not around it
Great mobile app monitoring is not just a technical safety net. It is a decision system for the whole startup. It helps founders know when to scale acquisition, when to pause a rollout, when to fix performance, and when product changes are actually improving retention.
If you are building a funded startup app, Appzay can help you design, engineer, launch, and support an iOS and Android product with monitoring considered from the start. From product strategy and UX to native engineering, cloud integration, release orchestration, and proactive maintenance, Appzay partners with founders to build mobile products that are ready for real users and real growth.